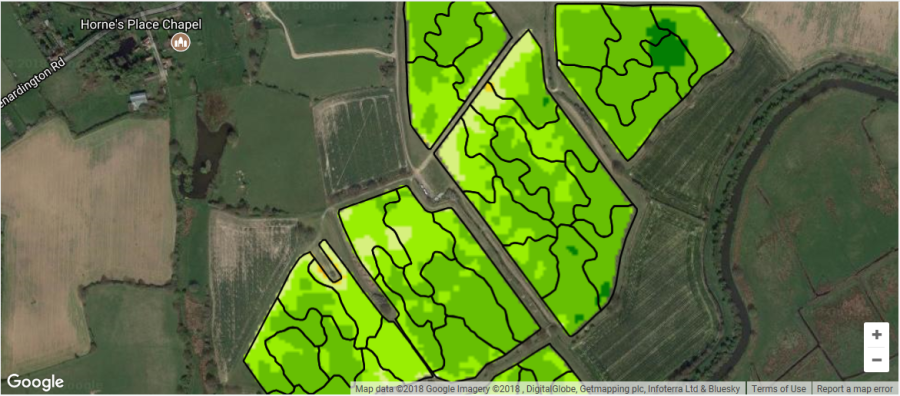
Have you ever thought it would be useful to get a bird’s eye view of your vineyard; an aerial perspective to assess variability and to monitor its status over time more effectively?
New applications using optical satellite data are now bringing this possibility to reality. Contour is a new information service offering a complete suite of farm monitoring tools. These include:
- Localised weather data
- Leaf wetness
- Soil moisture and temperature
- Field accessibility
- Optical satellite data (NDVI)
- Green area index
- In-field observation display
Weather data
By using information from the nearest weather station and land surface data, a model is able to calculate the weather conditions in your vineyard by pinpointing a central location on the site and interpolating this from the local topographical and satellite data. Wind speed and chance of precipitation can for example, be used for making spraying decisions.
Dashboard data display is a key feature of the Contour application.
Leaf canopy wetness
This is a parameter that describes the amount of dew and precipitation present on tissue surfaces. It is a key factor in the initiation and development of disease. Contour provides daily and hourly forecasts of leaf canopy wetness to guide crop management decisions and when to spray to protect the crop.
Soil moisture and temperature
The land surface model (LSM) provides a soil moisture and temperature forecast. It uses local weather, soil properties, topography and vegetation characteristics to compute the physical processes governing the movement of water and heat energy through the soil profile. This provides the soil moisture and temperature data, historical, in real time and forecast.
NDVI – Normalised Difference Vegetation Index
There are many factors affecting the variation in the greenness of the crop in the field. Contour will provide you with a tool to look at the NDVI imageries to monitor these variabilities throughout the growing season and allow you to investigate the cause of these variations in the vineyard.
Generally a crop will have a lower NDVI (yellow) if the soil is compacted, water logged, has low pH, low magnesium, low organic matter or high in disease. Higher NDVI (green) indicates healthier cropping or over vigour.
Dashboard data and field images can be viewed on your desktop or pinpointed in the field on your phone as you walk through the crop.


